

Re: Gridlines on Column Chart
Use Axis Options 'Intervals creates a coloured section within a donut chart depending upon the month status value.The valid values are R, A, G or blank.
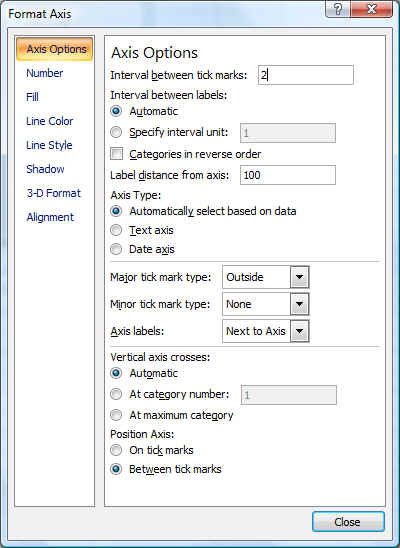
Select X axis and display Format Axis dialog. Within the Axis Options tab use the 'Interval between tick marks:' to determine major gridline spacing.
ng61.zip