Chart Labeler for PowerPoint
| |
| |
This is an add-in that allows you to select
a chart series and link the data labels to cells within the
Excel worksheet used to store the underlying data values. The
text can be stored in cells outside the table used for data.
|
| |
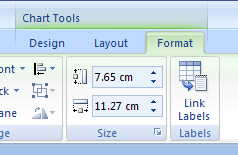
Once the add-in is installed and a
chart is selected a new button will appear within the Format tab
of Chart Tools contextual tab.
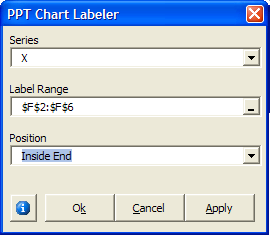
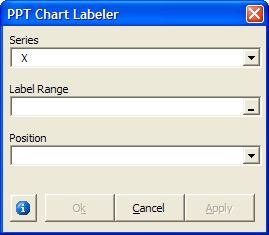
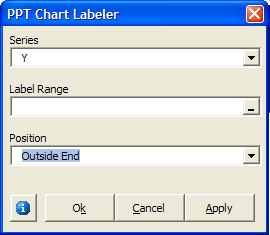
When the dialog first appears you need
to select the series to which you want to link data labels to
cells.
You can then click the Label Range dropdown
to automatically open the underlying Excel worksheet and select
the range contains text that you want linked to the data labels.
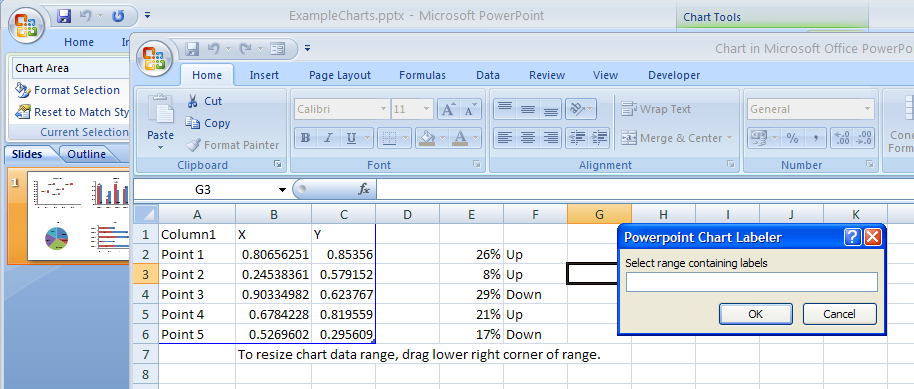
The range selected must contain the same
number of cells as there are data points in the series. It will
automatically handle invisible cells and the charts setting for
the handling of hidden cells. You can select vertical or
horizontal contiguous ranges or a non contiguous range.
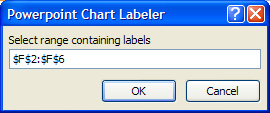
When you click OK the Excel worksheet will be
automatically closed. If the Excel application was not running
previously this too will be closed down.
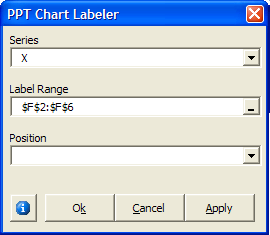
You can now select a position for the data
labels. The choice of positions will be dictated by the chart
type of the series being linked.
Finally you can click OK to update the data
labels and close the dialog. Or by clicking Apply the data
labels will be updated but further changes to this or any of the
other series in the chart can be made.
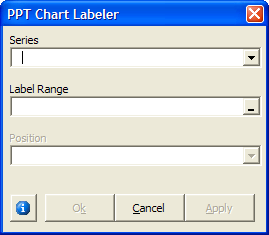
Additionally if there is no range defined you
can use the dialog to simply alter the position of the selected
series data labels. The Apply and Ok button will work as
described earlier.
You can either place the Add-in in the Addins
folder or browse to.
Install PowerPoint Add-in instructions
Add or load a PowerPoint add-in
|
| |
|
|
|
|
|
|

Created August 2004
Last updated 5th August 2014
 AJP Excel Information