| |
| |

|
| |
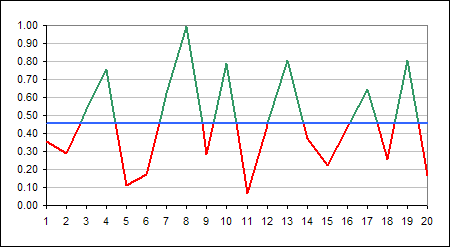
This chart displays a line that
changes colour depending on whether it is above or below a control line.
It is based on a xy-scatter chart.
The formula calculates all the intersections
and then the sorted values are plotted using 2 series.
Full credit goes to Dave Curtis, a forum member at
OzGrid. who provided the
formula to calculate the intersections.
I was able to add the formula to
dynamically sort the resulting values.
Update 16th February 2008:
Apollo Huang, a fellow MVP from China, pointed out a flaw in my sorting
formula, which was picking up incorrect cell values. I have incorporated
his formula revision in to the download.
The download
contains data based on the RAND function so will generate new values
automatically.
|
| |
|
|
|
|


