AJP Excel Information
Charts
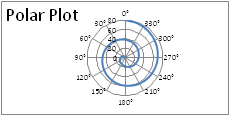
Polar Plot Add-in
Polar Plot Add-in including examples file.
Update for 32-bit or 64-bit Excel
More ...
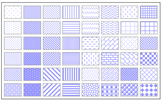
Chart Pattern Add-in
Add-In for applying Pattern fills to charts, tables and shapes in PowerPoint 2007
More ...
Ratio plot
Maintain plot area aspect ratio
More ...
Dashboard
A collection of tips compiled by guest poster Ceri Williams
More ...
Set square axis
VBA code to create square axis
More ...
Banding plot area on bubble chart
VBA code to align plot area of 2 charts
More ...
Formula conditional Line
A conditional line chart based on formula
More ...
Chart Pattern Fill Add-in
Add-In for applying Pattern fills to charts and shapes in XL2007
More ...
Line Circle Intersections
User Defined Functions to calculate intersections between lines and circles
More ...
Pie Sizer
Size pie charts plotarea
More ...
Conditional highlighting axis labels
Highlight axis labels
More ...
Polar plot charts
Polar plots
More ...
Pie slice radius
Pie chart with individual slice radius
More ...
Label high-low line with values
Add data values to High-Low line
More ...
XY Scatter colouration plot
Colour xy scatter points
More ...
Custom leader lines
Automatically updating custom leader lines
More ...
Positive/negative axis labels on bar chart
Axis label alignment when charting positive and negative bars
More ...
Bounding areas
Creating bounding area within xy scatter
More ...
Pie chart data markers
Use a pie chart as a data marker
More ...
Axis Pointer
Display pointer at end of axis
More ...
Display total on stacked column
Display a cumulative total on a stacked column chart
More ...
Invert if negative
An step by step explanation on how to control the Invert if Negative property
More ...
Delete single legend entry
An explanation of how to delete a single legend entry
More ...
Labeling last point
Label last point in a chart using dummy data series
More ...
Scrolling data chart
Dynamic scrolling through data
More ...
Spotlight chart
Alternate conditional dual category plot
More ...
Tile chart
Conditional dual category plot
More ...
Polar plot Add-in
An add-in to help create polar charts. Plus a workbook which contains examples of polar plots
More ...
Staggered Axis labels
Various methods to create staggered axis labels
More ...
Step line charts
Various ways and chart types that can be used to create a stepped line
More ...
Column chart with variable width columns
Column chart that has variable width bars, including a stacked style
More ...
Dividing graphic into sections
Split a graphic into variable width sections
More ...
Broken lines for formula linked data
An alternative to zero or joined points
More ...
Automatic removal of zero values in pie chart
A pie chart that does not display zero values
More ...
Pie chart tricks
Pie On Pie; Pie By Pie and Filled Doughnut chart
More ...
Column chart with variable width columns
Column chart that has variable width bars
More ...
Pie chart displaying single cropped image
A work around for multiple images in a pie chart
More ...
Cluster column chart with floating gap
A worked example of a clustered column chart with a floating gap column
More ...
Broken axis on column chart
A worked example of a column chart with a break in the value axis. Display data with large variance between min and max values
More ...
Traffic light chart
A worked example of a conditional chart
More ...
Side by side stacked columns
A worked example of Side by Side stacked column chart. Extended to handle xl97 category label limitations
More ...
Different width stacked bars
A worked example of 2 sets of stacked bars with different widths
More ...
Datum lines
Average line on chart. A collection of methods and charts styles
More ...
Floating bar cluster
Floating bar chart with the bars clustered
More ...
Thermometer chart
Thermometer style charts
More ...
Mini XY Scatter plots
Matrix of mini xy scatter plots
More ...
Stacked Pos/Neg bar
Stacked positive and negative bar chart with series order maintained
More ...
Conditional Line
Change the colour of a line as it passes above or below a fixed datum line
More ...
3D xy-scatter
Simulated 3d XY scatter
More ...
Complex Intersections
Mark the points of intersection between two lines
More ...
Gauge chart
A speedo style chart
More ...
Created August 2004
Last updated 13th December 2014
Microsoft® and Microsoft® Excel are registered trademarks of the Microsoft Corporation.
andypope.info is not associated with Microsoft. Copyright ©2007-2016 Andy Pope
 AJP Excel Information