

Polar Plot 2 add-in.
The add-in will help you to create a polar plot from your angle and distance data.
There are now 3 versions to handle the different versions of Excel. The latest version will work on 32-bit or 64-bit Excel.
In Excel 2013 the chart tools contextual menu removed the Layout tab. So I have now moved the update button to the design tab. To be consistent I have also moved the update button to the design tab for the Excel 2007/2010 version.
The latest version includes auto angle generation. You can specify the start and end angle which will distribute the data points across.
Excel 2013 version

Excel 2007 or 2010 version
Excel 2003 version
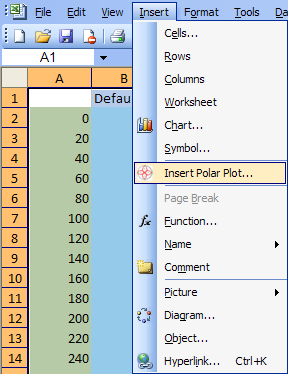
For instructions on how to install add-in Once installed the add-in creates 2 new buttons on the ribbon. The first is the Create button added to the Insert tab.
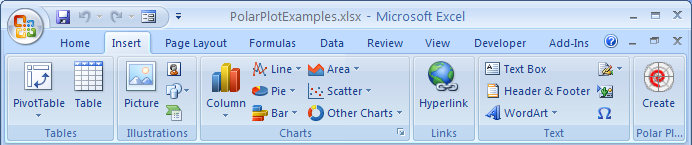
Use the Create button to initiate the Create dialog. If you select your data range in advance the add-in will attempt to use your data layout to preload the data parameters.
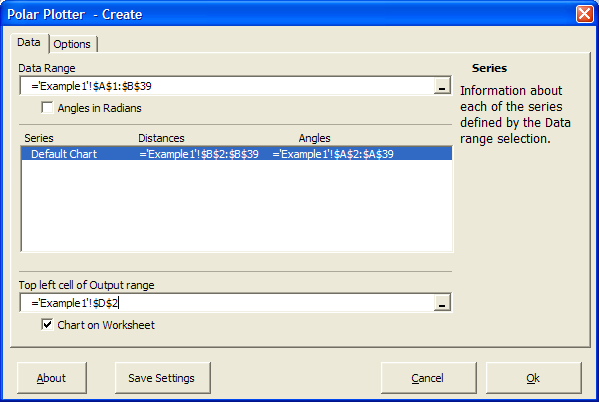
The Data tab allows you to select the data range. The data layout should be angles in first column with adjacent columns containing distance data for each series you which to include in the plot. By default the calculated chart data will be stored to the right of your data with a single column space between. This new data is a store of the chart options as well as information use to create the charts labelling, axes and then actual series lines. Once you have created your polar chart you can edit it using the Update button added to the Design tab of the Chart Tools contextual tab.
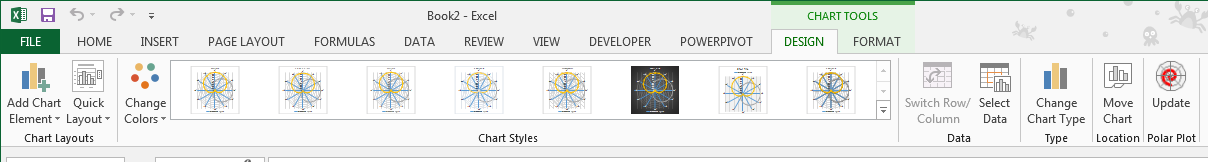
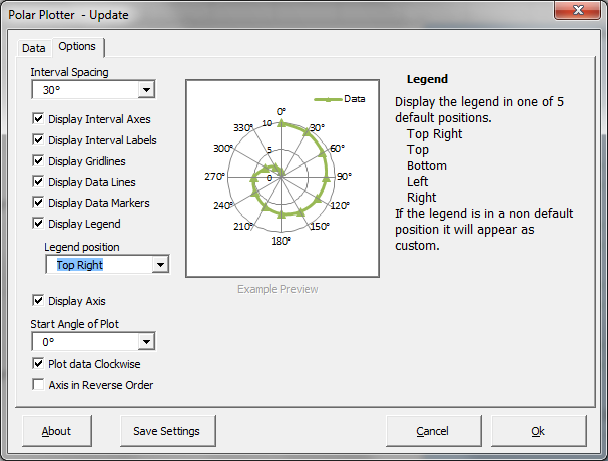
The Update button invokes the add-in with the Options tab populated and displayed.

The example preview gives you a view of the changes made. Moving the mouse over a control will display explanation text. You can also update the Data settings.
Here are some examples.
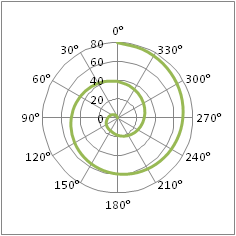
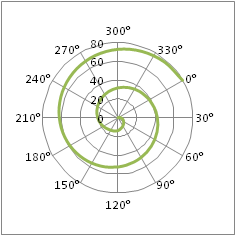
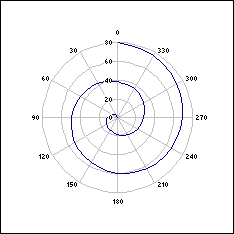
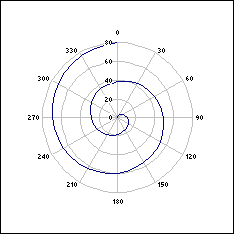
Default chart
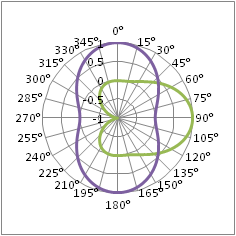
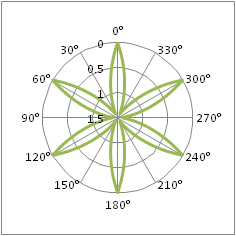
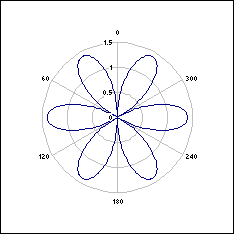
Multiple series
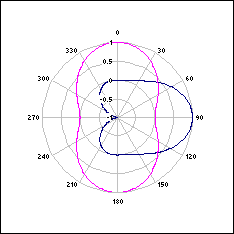
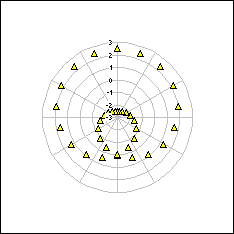
Negative data values
Gaps in the data
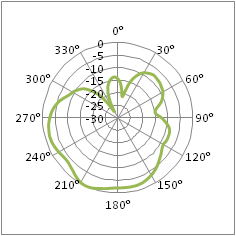
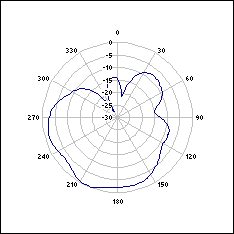
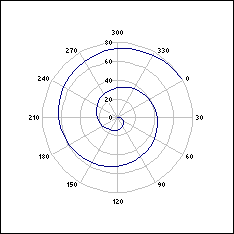
Clockwise direction
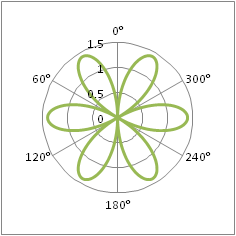
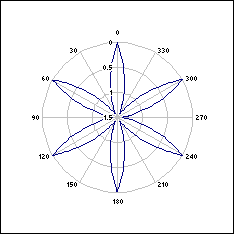
Different interval labels
Offset interval start
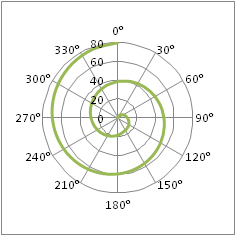
Value axis in reverse order
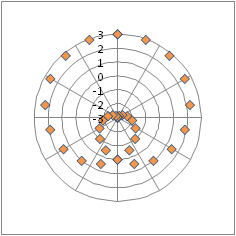
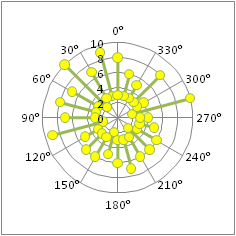
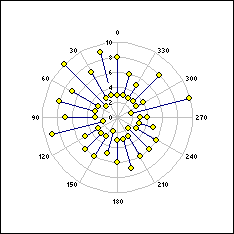
Data markers only and no interval labels
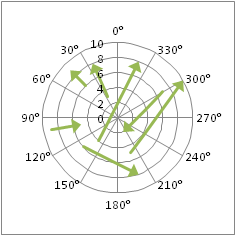
Gap data with line manually formatted to have arrow endings
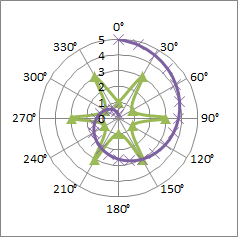
2 series with different angle data in single chart
Once installed the add-in creates 2 new buttons within the menus. The first is the Create button added to the Insert menu.
Use the Insert button to initiate the Create dialog. If you select your data range in advance the add-in will attempt to use your data layout to preload the data parameters.
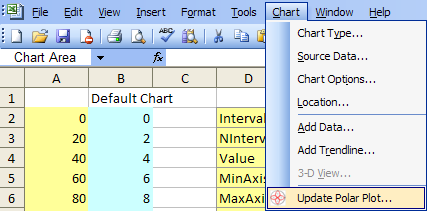
The Data tab allows you to select the data range. The data layout should be angles in first column with adjacent columns containing distance data for each series you which to include in the plot. By default the calculated chart data will be stored to the right of your data with a single column space between. This new data is a store of the chart options as well as information use to create the charts labelling, axes and then actual series lines. Once you have created your polar chart you can edit it using the Update button added to the Chart menu.
The Update button invokes the add-in with the Options tab populated and displayed.
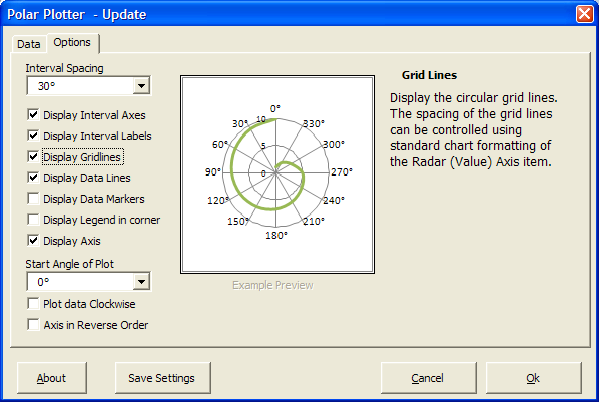
The example preview gives you a view of the changes made. Moving the mouse over a control will display explanation text. You can also update the Data settings.
Here are some examples.
Default chart
Multiple series
Negative data values
Gaps in the data
Clockwise direction
Different interval labels
Offset interval start
Value axis in reverse order
Data markers only and no interval labels
Once the chart has been created you can format the interval labels, interval lines, circular gridlines, values axis and each series using the standard chart formatting methods.
xl2003 download


- v4.2 Bug fix for bad save settings
- v4.0 Updated coding to handle 32bit or 64bit Excel
- v3.1 Added auto angle generation. (not applicable to 2003 version)
- v3.0 Moved Update button to Design tab. Added legend layout options. (not applicable to 2003 version)
- v2.4 Bug fix for Chart on Worksheet setting
- v2.3 Amended formula to handle scaling which does not pass thru zero.
- v2.2 Amended formula to handle negative values when user alters the minimum scale value.
Added a Save Settings option that will store current dialog settings in the registry for use when creating future polar plots. - v2.0 release version