| |
| |
Re: Datum line and split series
|
| |
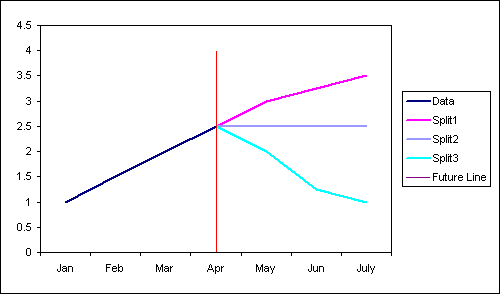
A standard line
chart with a datum line to illustrate point of future data.
Combined with a data series that splits into 3 future data
series.
|
| |
A |
B |
C |
D |
E |
F |
G |
| 1 |
|
Data |
Split1 |
Split2 |
Split3 |
FutureLine |
Error |
| 2 |
Jan |
1 |
|
|
|
0 |
0 |
| 3 |
Feb |
1.5 |
|
|
|
0 |
0 |
| 4 |
Mar |
2 |
|
|
|
0 |
0 |
| 5 |
Apr |
2.5 |
2.5 |
2.5 |
2.5 |
0 |
4 |
| 6 |
May |
|
3 |
2.5 |
2 |
0 |
|
| 7 |
Jun |
|
3.25 |
2.5 |
1.25 |
0 |
0 |
| 8 |
July |
|
3.5 |
2.5 |
1 |
0 |
0 |
Select the range A1:F8 and
create a standard line chart no markers.
Double click the Future Line series and set the Y Error bars
Custom series to G2:G8
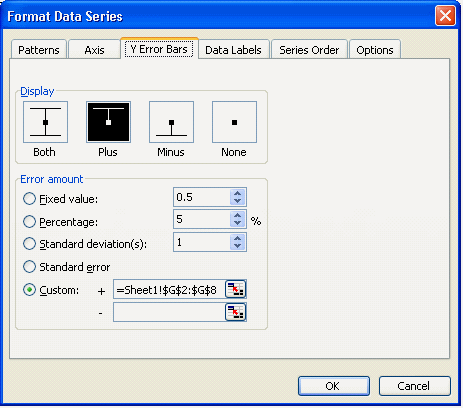
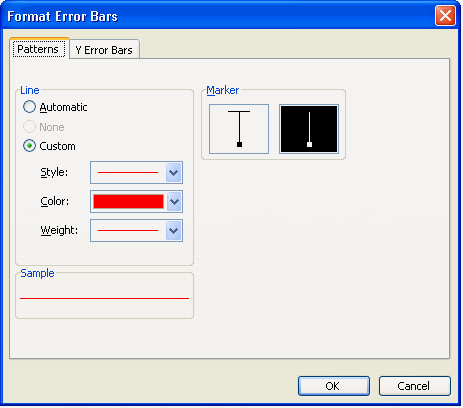
Double click the
error line and format that as requried.
If you require
the datum line to completely cover the plot area you will need
to fix the maximum value of the Y axis.
|
| |
|
|
|
|
|
|
Created August 2004
Last updated 5th August 2014
 AJP Excel Information