| |
RE: Point and Bar chart (MSGraph)
|
| |

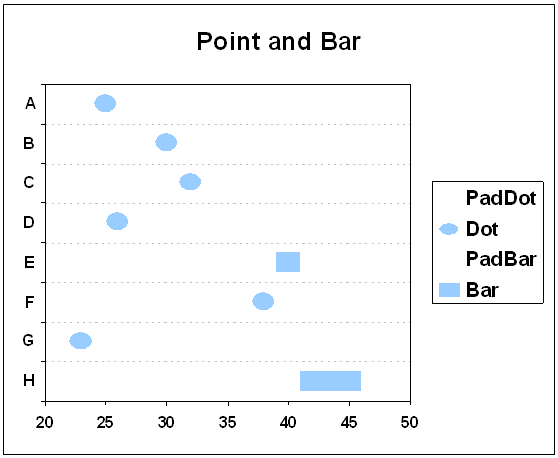
The chart is a stacked bar chart
with a custom fill used to display the point.
|

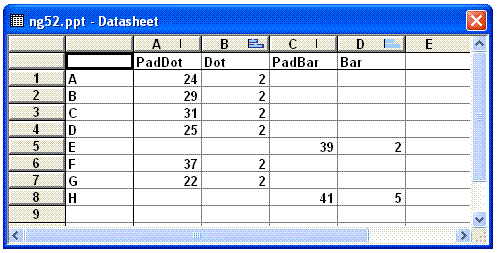
The PadDot values in the data
sheet will need to be adjusted in order to compensate for half
of the Dot value
|
| |
Once you have created the
stacked bar chart you can format the 2 pad series to have no
fill and no border.
The reason for two pad values is in case you want both point and
bar on the same row, although the data values will not be
allowed to overlap. In order to have overlaps you will need to
move the PadDot and Dot series to the secondary axis.
To create the point in use an
oval autoshape. Cut and Paste this to the Dot series.
|
|
|
 AJP Excel Information

